Before you read on, you might want to download this entire revision notes in PDF format to print it out for your child, or yourself to read it later.
This will be delivered to your email inbox.
Welcome back to another instalment on experimental techniques! In our previous article (see Laboratory and Experimental Techniques), we have covered the essentials of lab work, namely lab safety, common equipment and a framework for planning experiments.
In this article, we will be putting that knowledge to work on some real SEAB O-Level questions from previous years. Rather than reading from model answers, we’ll go through the thought process of a thinking scientist, identify the aim and variables, choose the right apparatus and plan a safe experiment.
Practical examinations set by SEAB stand out from written papers as they test more than just theory. The three extra features are:
It’s recommended to read through the paper with a pencil or highlighter in hand to mark out any important key words, equations and precautions. Some students also prefer to use this initial prep time to answer any theory questions that can be solved early, while others prefer answering them later after having some time to think them through between experiments – this is up to your personal preference. Take note if there are any experiments that include a long wait time – you can make use that time effectively by answering questions or drawing graphs for other sections.
The practical paper is as much a test of time management as it is a test of chemistry knowledge, so knowing what needs to be done and in which order to do them will bring you a great way ahead towards completing all experiments within the allotted time. That’s why the best thing to do the moment the exam starts is not to rush to get whatever reagent is nearest, but to take a deep breath and read through the paper once over.
Read and follow all instructions
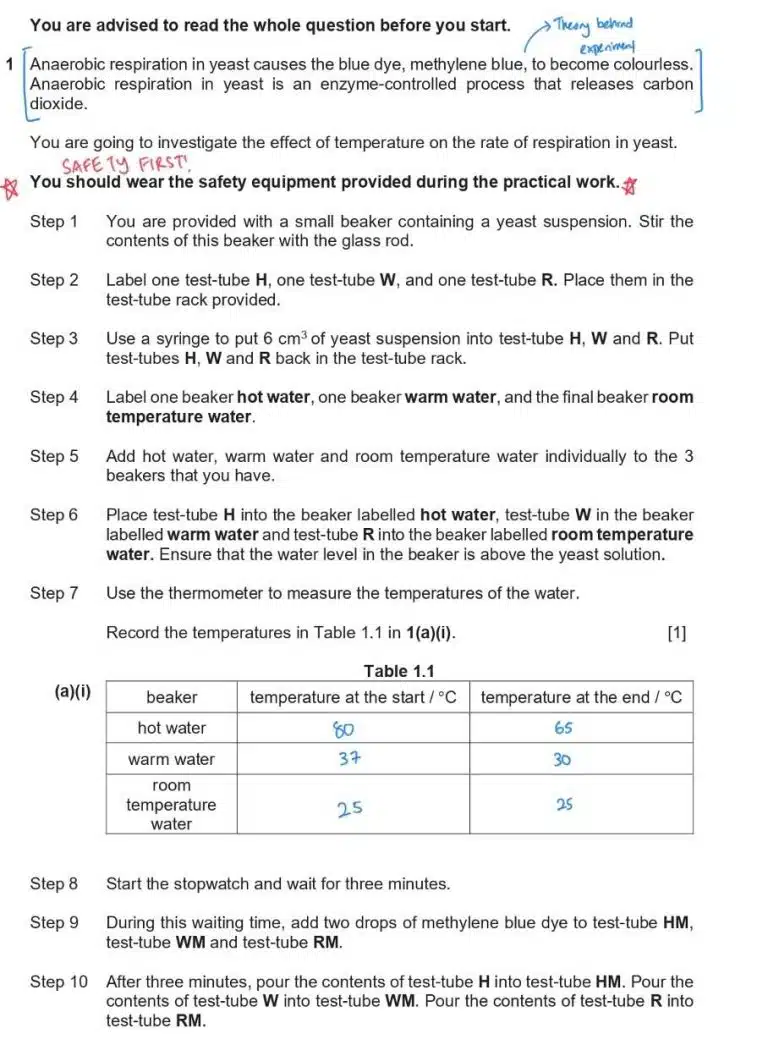
It’s written at the top of the exam paper for a reason. You are advised to read the whole question before you start. All the information you need is weaved into the instructions, and taking some time to read everything carefully gives you the full picture of the experiment. This way, you’d know exactly what is to be expected before you dive into the experiment, and avoid the stress of realising that you’ve missed a crucial detail.
As you read, take time to highlight key details and even sketch out the experimental steps in your own words. This not only helps you visualize what you’ll be doing but also gives you a clearer idea of what to expect.
Keep in mind that practical experiments are simply a demonstration of scientific theory. There will usually be some lines mentioning the theory behind the particular question being tested. Deep an eye out for lines that hint at the theory behind the experiment, as understanding these will put you in a stronger position to answer follow up questions later on.
Once you have identified the theory behind the experiment, it’s time to identify the variables. Remember, the dependent variable depends on the independent variable. Hence, the independent variable is a factor that you are able to change as the experimenter, and the dependent variable is the outcome that responds to those changes.
While carrying out your experiment, make sure to record your observations at every step. Do note down the independent variable you’ve changed and the corresponding outcome in the dependent variable. Remember to stay alert, as many reactions are brief and easy to miss. By concentrating and observing carefully in real time, you’d be able to catch those fleeting but crucial moments when the results appear.
Sample Question 1: Bar graphs
Let us take a look at some sample practical questions. Take some time to read the question carefully. As usual, pay attention to any text that alludes to experimental theory and instructions concerning your safety.
*Disclaimer: The author has not personally performed the experiment, so all “recorded” values have been theoretically estimated. During the actual practical examination, be honest and record your observations as accurately as possible.
Source from Chung Cheng High School Preliminary Examination 2022
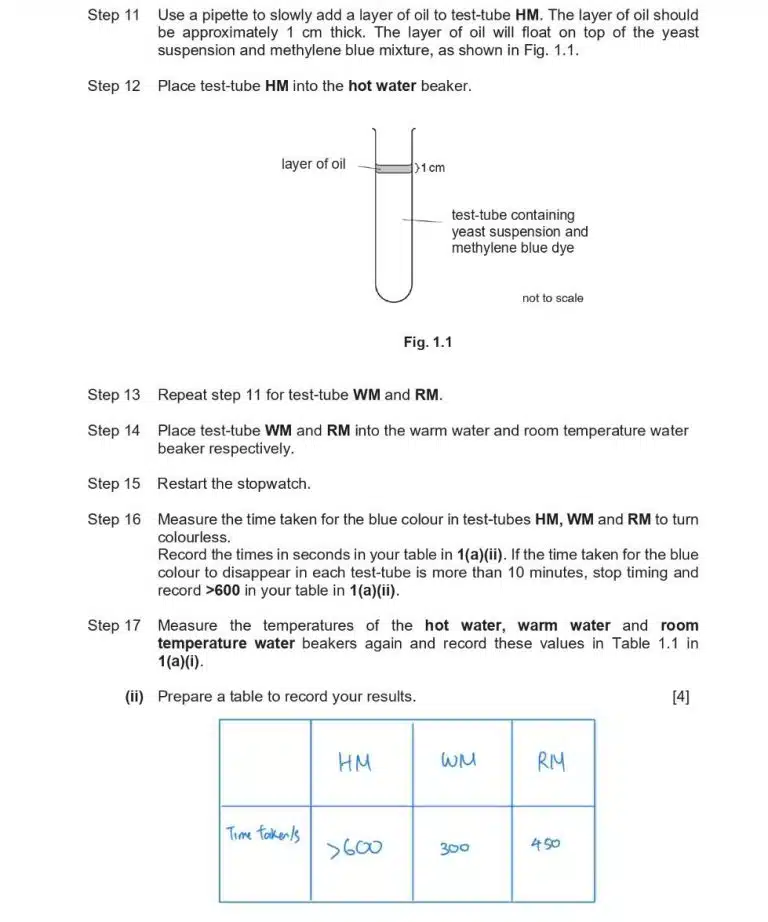
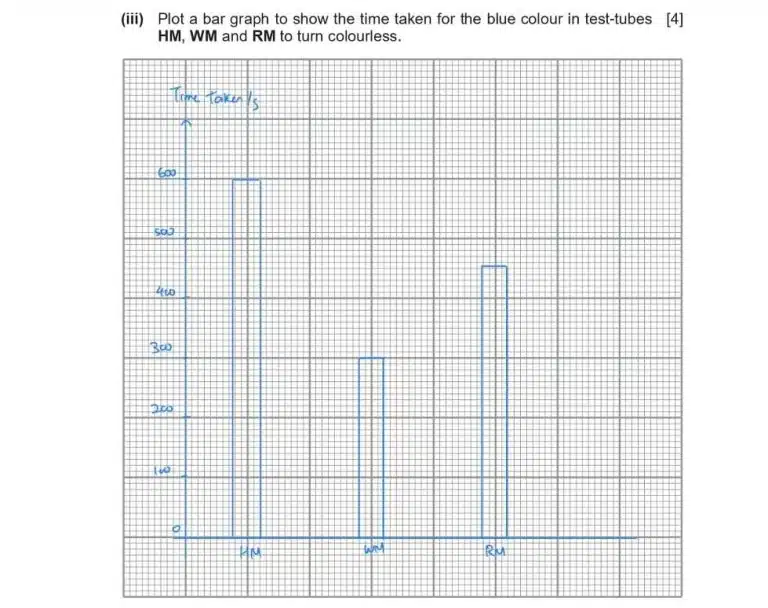
This question asks you to draw a bar graph based on the time taken for the blue colour of methylene blue to disappear. When drawing graphs, follow these simple rules and you’d have no problem generating a beautiful graph that examiners will love!
Example: For this bar graph, the smallest division per square is 10. If you have a value of 304, round this off to the nearest half-square (5), which is 305.
Another type of graph commonly tested is a best-fit line. A best-fit line (also known as a trendline or linear regression line) is a straight line drawn on a scatter plot that represents the general trend or relationship between your independent and dependent variable in a dataset. This line minimises the distance between itself and all data points and allows one to readily see a visual representation of a trend, and even predict outcomes based on the established trend.
Source from Commonwealth Secondary School Preliminary Examination 2022
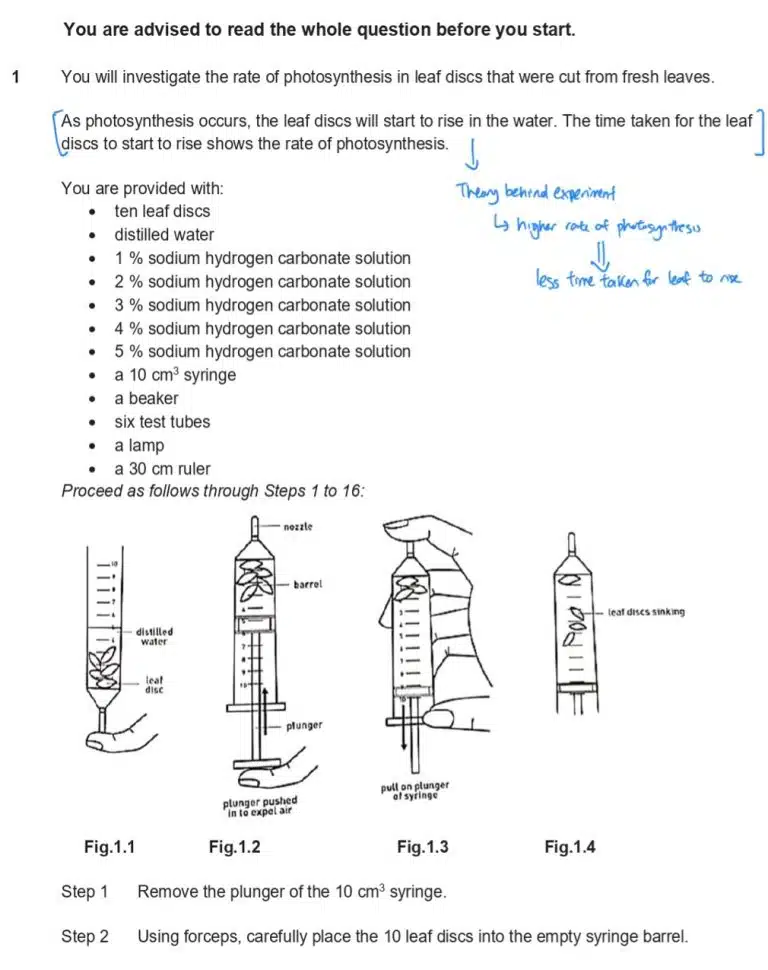
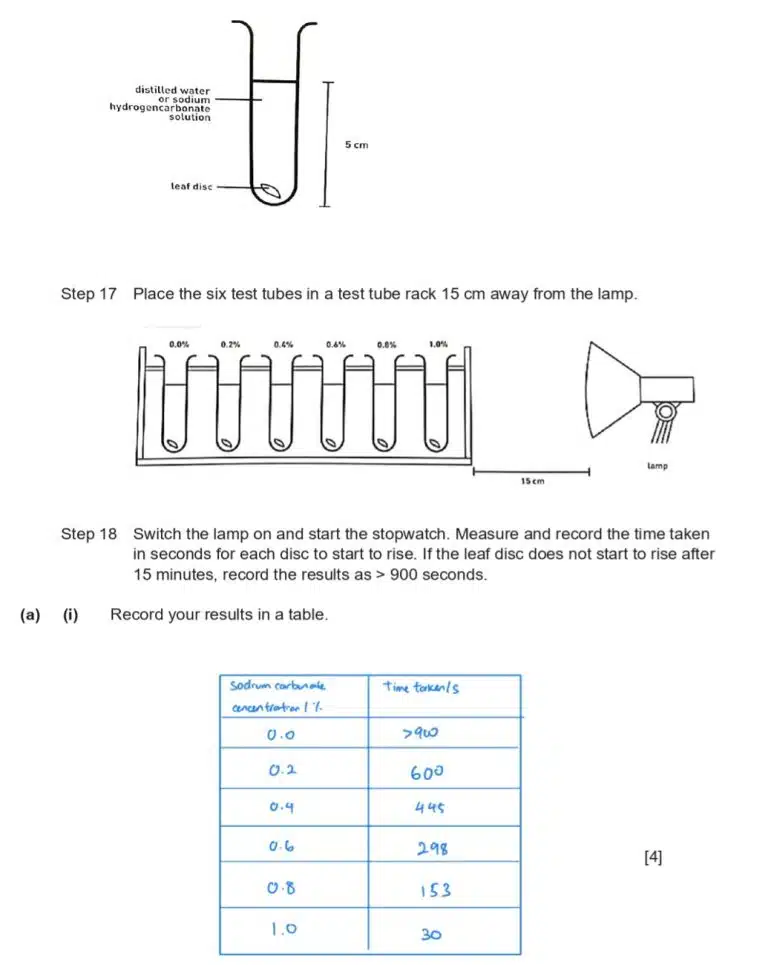
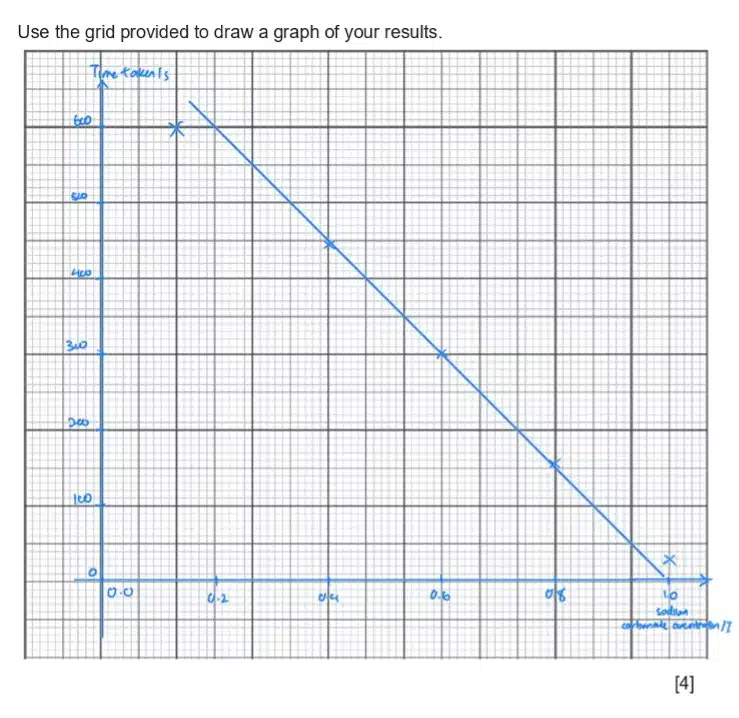
The same graph-drawing guidelines as discussed earlier still apply. In this case, we are expected to draw a best-fit line representing the relationship between a higher concentration of sodium carbonate and the time taken for a leaf disc to rise, which is also a measure of photosynthesis rate.
Like any other graph, do be careful and try to plot your observed values as accurately as possible. After all your values have been marked out, grab a ruler and try to map out a best-fit line. An ideal best-fit line should:
Your best-fit line will not always be perfect, due to experimental errors and inaccuracies, but aim for the best balance you can!
Your best-fit line can now be used to make predictions about your observed trend! However, do note that your best-fit line is only reliable within the values you have experimentally tested. Avoid extrapolating beyond that range unless specifically requested for by the question. For example, you can confidently predict the time taken for the leaf disc to rise in 0.5% of sodium carbonate, but not for 1.5% as it is not part of your observed data.
Source from Commonwealth Secondary School Preliminary Examination 2022 Q1bi
![A question asks the student to describe the pattern shown by their graph, followed by blank dotted lines for the response and a mark allocation of [2] at the end.](experimental-techniques-breaking-down-o-level-sample-questions_files/Preliminary-Examination-Secondary-2022-5-768x226.jpg)
Questions that ask you to draw a best-fit line often follow up with asking you to describe the pattern shown in your graph. This can feel quite intimidating, since it means turning your visual observations into words. Do not fret, as these questions are just really asking you to state how your independent variable has changed with your dependent variable. An acceptable answer would be:
“As the concentration of sodium carbonate increases, the time taken for the leaf disc to float decreases.
In many papers, you’ll encounter a planning question worth around 6 marks. These questions usually present a hypothesis and ask you to design an experiment to test it. To score well, make sure to consider these key points:
Source from Chung Cheng High School Preliminary Examination 2022 Q1d
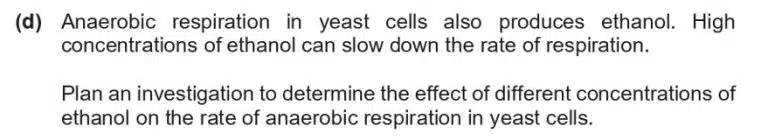
First, let us identify the aim of this experiment, which is to find out how different concentrations of ethanol affect the rate of anaerobic respiration in yeast. Here, the independent variable is the concentration of ethanol, and the dependent variable is the rate of respiration.
We can vary the independent variable by simply preparing different concentrations of ethanol. How would we measure the outcome of the independent variable? Usually, these planning questions build on an experiment you have just performed. In this case, this question links back to the methylene blue experiment we discussed earlier when learning how to plot bar graphs.
So, we can take inspiration from that protocol: the rate of respiration can be measured by recording the time it takes for methylene blue to turn colourless. The experimental outcome can be inferred from the question, which states that a higher concentration of ethanol slows down respiration.
An acceptable answer will be as follows:
Prepare several concentrations of ethanol. In a test tube, add a few drops of methylene blue, followed by yeast suspension and ethanol solution. Repeat this for all other concentrations of ethanol prepared. Record the amount of time taken for methylene blue to turn colourless. The higher the concentration of ethanol, the lower the rate of respiration and hence the longer amount of time taken for methylene blue to turn colourless.
Biology is a highly visual subject, which makes drawing an important way to record observations. The good news is, you don’t need to be an artist to succeed. Biological drawings have simple, clear requirements designed to ensure that anyone can capture and communicate their observations accurately.
Source from Commonwealth Secondary School Preliminary Examination 2022 Q2ai
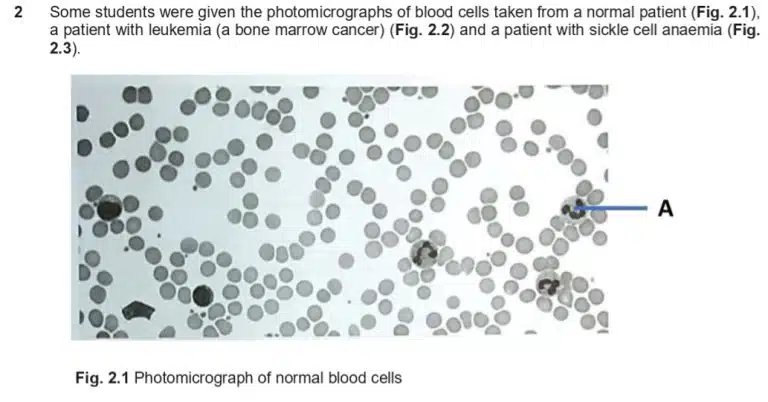
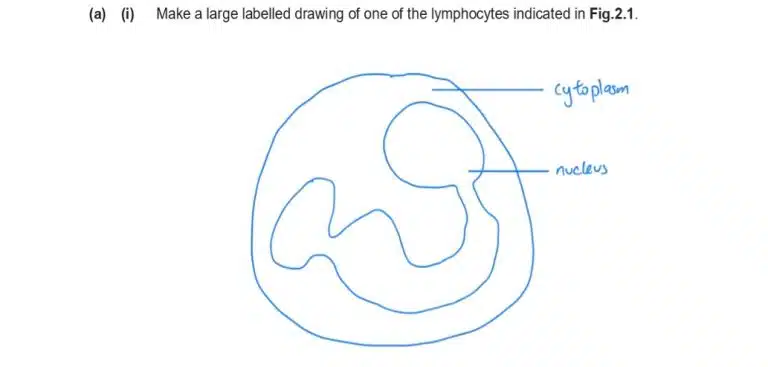
Observe that the drawing only uses simple lines, with no colouring or shading. The only organelles that are visible in the microscopy image are the nucleus and cytoplasm, so those will be clearly labelled. Be sure to replicate the shape and structure of the nucleus accurately, as faithful representation is key to a proper biological drawing.
With that, we have gone through and examined sample questions on the three key components of practical examinations:
Success in the practical exam isn’t just about preparation, it also depends on your focus and attentiveness in the moment. Hence, remember to live in the moment and be observant of experimental outcomes to ace your practical exams! Stay humble, observant and curious!
Find out more by joining us at Science of Studying!
Prepared by: Michelle
You might want to download a pdf copy of this article for future reference!
Click the white download button below, enter your email, and the pdf file will be delivered to your inbox! (Remember to check spam!)
The Science of Studying provides live online tuition via Zoom classes for Combined/Pure Chemistry, Biology, and Physics. To date, we have taught 800+ students over 12 years.
In case you are wondering, yes – there is a science behind studying!
At Science of Studying, we use our SOS system™ to teach our classes so that even last-minute students can see remarkable improvements in their grades – without mind-numbing memorisation of textbooks and without the drudgery of doing numerous assessment books.
All these conducted in a fun, interactive, stress-free online environment.
If you need help with your Chemistry, Biology, and Physics subjects, do reach out to us and we will see what we can do to help.
Contact Us: Click Here
Admin number: +65 88082348

The SOS system™️ guides students through an effective process of:
Join our proven online tuition programs and see real improvements in understanding, confidence, and school results.
Book a free trial lesson and start the journey today or discover more below:
WhatsApp us