Before you read on, you might want to download this entire revision notes in PDF format to print it out for your child, or yourself to read it later.
This will be delivered to your email inbox.
The ‘O’-Level Chemistry Paper 3 Practical Exam is weighted at 20% of the entire assessment, and if you feel like it is the most difficult section to prepare and revise for, don’t worry, because you’re not alone. Unlike the theory-based Papers 1 and 2, which while challenging, are relatively straightforward to practice for through various assessment books and study materials, your score in Paper 3 depends on your ability to perform real laboratory experiments within the provided time limit. Since students spend much less time in the laboratory compared to the classroom, it is common for them to feel a little out of depth and underprepared when it comes to practical exams, especially when they have not had many regular practical lessons in school. Hence, it is crucial to understand the format of Paper 3, and be aware of the skills tested during the practical exam. Here are 5 specific tips you can use to help you prepare and gain confidence in tackling specific portions of the ‘O’-Level Practical.
With several experiments to clear and limited time to complete them, your first instinct upon being told to begin your test might be to start grabbing the nearest flask and get to work immediately. However, reading the instructions as you go along is the single most common source of mistakes in a practical exam – raise your hands if you’ve ever thrown away a solution you had to keep for, added in a reactant at the wrong step, or recorded the wrong set of data because you didn’t realise what was to come!
Making a mistake partway through an experiment can cost us a lot of time and add on a lot of pressure, especially if the only way to fix it is to start from the beginning again. Hence, one of the simplest but most effective ways to keep your cool during practical is to go through all the instructions and questions once before starting any experiment. It only takes between 5-10 minutes, but it will save you so much more time because instead of frantically flipping through the paper to figure out the next step, you’ll know what to do and when.

It’s recommended to read through the paper with a pencil or highlighter in hand to mark out any important key words, equations and precautions. Some students also prefer to use this initial prep time to answer any theory questions that can be solved early, while others prefer answering them later after having some time to think them through between experiments – this is up to your personal preference. Take note if there are any experiments that include a long wait time – you can make use that time effectively by answering questions or drawing graphs for other sections.
The practical paper is as much a test of time management as it is a test of chemistry knowledge, so knowing what needs to be done and in which order to do them will bring you a great way ahead towards completing all experiments within the allotted time. That’s why the best thing to do the moment the exam starts is not to rush to get whatever reagent is nearest, but to take a deep breath and read through the paper once over.
From the first moment chemistry students learn the word “titration”, it is repeatedly emphasised how important it is to measure the exact volume of titrant in the burette that will just react with the sample in the flask. We are taught to add the titrant in dropwise while swirling the flask to make sure we don’t miss that first drop that produces the permanent colour change we’re aiming for, and so from day one, many students are primed to approach any titration experiment with a great deal of care and precision.
However, what sometimes gets forgotten in the pursuit of precision is the simple practical matter that adding in a reactant dropwise from a burette takes a lot of time. This is why teachers suggest that you add in the reactant quickly at the beginning of a titration and start reducing the speed to dropwise only when you see the first spots of (non-permanent) colour change.
But this does not change the fact that burette taps are notoriously tricky to handle, especially for those with limited experience in the lab. Hence, oftentimes students wonder at which volume exactly they can prepare to adjust the tap, and how they can tell if they’ve gotten the right colour, or have added just a little bit too much titrant. Unfortunately, no one can give a definitive answer to that because the reagents and concentrations are different for every experiment.

Since most titration experiments expect students to get at least 2-3 sets of titration data and select 2 sets that are consistent for further calculation, one strategy to estimate the end-point volume is to do a rough titration first, followed by two more accurate titrations later. This means that for your first titration, you can let the burette tap run quickly and stop after you notice a colour change – even if it is beyond the end-point volume.
While it may feel like a waste of solution and data to do an “inaccurate” titration first, it gives you the benefit of knowing 1) what volume the true titre volume has to be lower than and 2) the full spectrum of colour changes before, at, and after the end-point, within a relatively short period of time. This knowledge can help you perform the two accurate titrations afterwards more quickly and efficiently, saving you time and effort in the process.
For example, let’s say you are titrating a solution of hydrochloric acid in the burette against a sample of sodium hydroxide in your conical flask, using methyl red as the indicator. You do a rough titration first, and when you stop the tap at a burette reading of 28.00 cm3, the solution in the flask has changed colour from yellow to a bright red, which is beyond the end-point colour of orange.
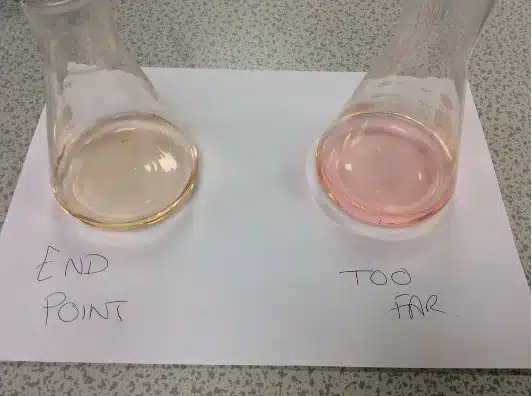
This tells you that the actual volume at end-point must be below 28.00 cm3, so for your next titration, you can add solution quickly until about the 20.00cm3, after which you can start adding additional acid dropwise to catch the colour change. Repeat the experiment once more with the correct titre volume and now you have two sets of volumes within 0.10 cm3 of each other.
Of course, there are many students who are able to do their first and second titration accurately, so they do not need to do any rough titration. However, if you are not as confident in your titration skills, or struggle to get two consistent titre values within the time given, perhaps giving yourself permission to do it imperfectly the first time so that you can land the second and third tries flawlessly might be the way to turn things around.
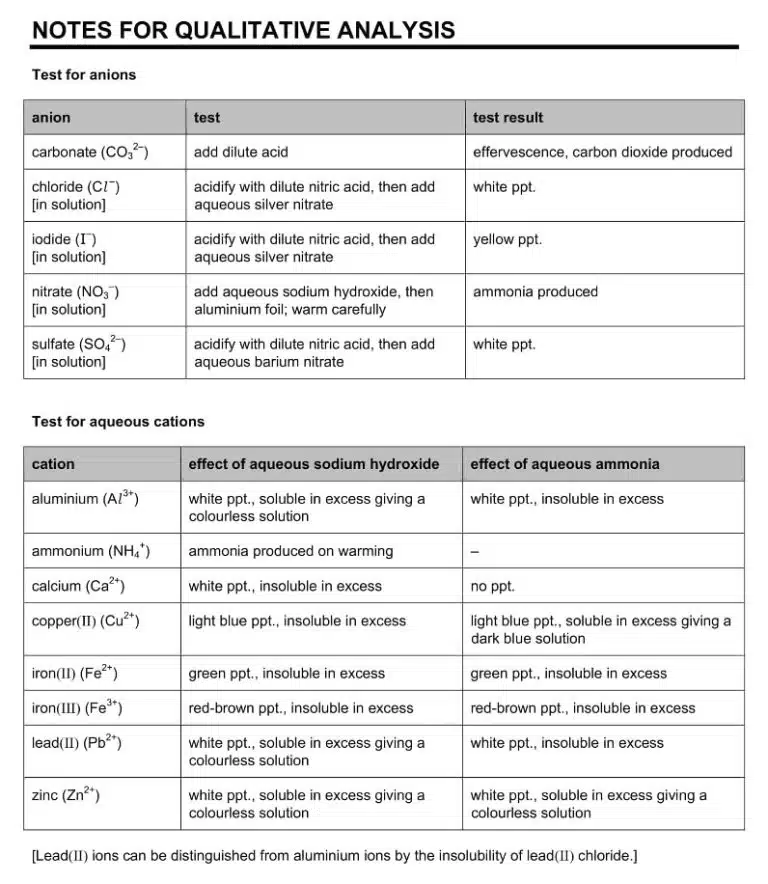
Qualitative analysis (QA) is a cornerstone for Chemistry practical exams, and many students find it difficult to study for since they must memorise and recognise different tests and observations for different gases, cations and anions, many of which are very similar and easy to confuse for one another. With the added pressure of an long laundry list of tests to perform on several unknown samples within a short amount of time, it’s understandable that even those who generally do well in the theory section can lose their cool and miss cues for certain tests, or misreport their observations.
Take testing for gases as an example; most QA experiments only ask students to “test and identify any gases evolved”, without explicitly mentioning what gas to test for and at which step. This is because the ‘O’-Level examiners expect candidates to be able to anticipate when a gas might be produced, and prepare the appropriate test beforehand. Unfortunately, many students do not realise that this is one of the skills tested, and are completely caught off guard when their test tube produces effervescence, or scramble to try every possible gas test before the reaction ends.
The truth is that testing for every possible gas is not practical or even necessary, and predicting what gas is likely to be formed and when is doable from reading the test instructions beforehand.
For example, based on our knowledge that carbon dioxide if formed when an acid is added to a sample containing carbonate ions, or when a solid carbonate is heated until it decomposes, we should begin to suspect that any test that asks us to add an acid to a solution or a solid, or heat a solid until no further changes are observed, may involve a carbon dioxide test. This gives us the foresight to prepare limewater and a delivery tube beforehand so that we are ready to test for gas at the first sight of effervescence. Similarly, if a test involves heating a solution with aluminium foil, then it is likely that ammonia gas may be produced, so we can have some red litmus paper ready on hand.
We can do the same thing with regards to anion tests: for example, if the instructions tell us to add aqueous barium nitrate or barium chloride to a solution, we can predict that this is a test for the sulfate ion. In that case, only two observations are possible: either a white precipitate is formed, or no precipitate is formed at all. Anticipating the possible observations before performing the test in this way removes some of the uncertainty in what we can expect to see and report, which not only helps us to stay calm during the exam, but also allows us to notice and respond accordingly when something unexpected does occur.
Qualitative analysis (QA) is a cornerstone for Chemistry practical exams, and many students find it difficult to study for since they must memorise and recognise different tests and observations for different gases, cations and anions, many of which are very similar and e
It is no secret that keywords and using the correct terminology is crucial to scoring in ‘O’-Level Chemistry. So, it is also not surprising that during a practical test, markers are looking out for specific phrases and descriptions in order to grant points. While it would definitely be easier on candidates to use their own words to explain what they are observing, the examiner marking the paper can only evaluate their performance based on the submitted answer sheet. Since the examiner cannot see the situation in the laboratory during the practical, differences in phrasing could give rise to miscommunication about what the student actually saw and understood about the experiment, which could result in them being marked down due to lack of clarity.
Hence, one skill to master before the actual practical exam is to use accurate terms and phrases to communicate your predictions, observations and explanations. Luckily for us, it is possible to practice this even without having a lot of school lab sessions beforehand, since there is a great deal of overlap with the phrases and keywords used in both the practical and theory papers. In other words, revising your notes and practicing structured questions from past year papers will also boost up your answering techniques for practical exams. It is also a good idea to pay close attention to questions involving experimental procedures, colour changes and predicting observations – much of the vocabulary and phrasing in these questions also carry over to practical papers.
asy to confuse for one another. With the added pressure of an long laundry list of tests to perform on several unknown samples within a short amount of time, it’s understandable that even those who generally do well in the theory section can lose their cool and miss cues for certain tests, or misreport their observations.
A few tips regarding keywords and phrasing:
“Precipitate” vs “Residue” vs “Solid”:
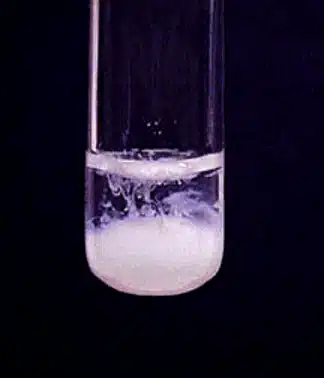
A “precipitate” is an insoluble solid that is produced from a solution after a reaction has occurred i.e. the insoluble solid did not exist in the solution before the reaction. It is produced as a powder or small flakes from within the solution itself. If only a small amount of precipitate is present, it could cause the solution to appear milky or cloudy – in that case, write down that “a (colour) precipitate is produced”.
A “residue” is the solid left behind in the filter funnel after filtration, but “residue” also describes the solid left behind after thermal decomposition.
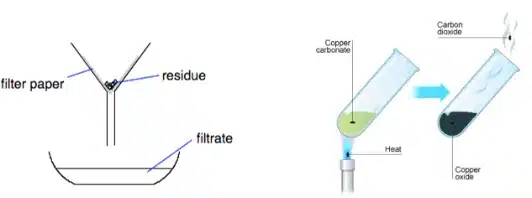
A “solid” is anything that is in the solid state. As it is the broadest descriptor, we should use it only when neither “precipitate” nor “residue” is suitable.
For example, during a displacement reaction where a magnesium strip is added to a solution of copper(II) ions, reddish brown copper metal will be formed on the magnesium strip. This is not considered a “precipitate” as it deposits onto the metal surface instead of spontaneously appearing from the solution itself, and it is not considered a “residue” since it was not left behind after filtration or thermal decomposition. Hence the best description for this observation would be, “A reddish-brown (layer of) solid is formed on the magnesium strip”.
It is very common for students to indicate any and all negative results to a chemical test (when no precipitate is formed, when no gas is produced, when no colour change occurs, etc.) with “no visible change”. While it may seem like a convenient phrase to show that the test did not produce the expected positive result, this is in fact not the best way to indicate a negative result.
Use of broad claims like “no visible change” or “no observations” are discouraged during the practical exam, as it could be interpreted by the examiner to mean that the student did not even observe the sample, or that the student did not know or anticipate what the expected positive result should have been. Hence, a more accurate way to indicate a negative result is to write that the expected positive observation did not happen instead.
Examples:
Test for chloride ion: Add acidified silver nitrate to sample.
Expected positive observation: White precipitate produced
Negative result: “No precipitate produced”
Test for carbonate ion: Add hydrochloric acid to sample.
Expected positive observation: Effervescence of gas that produces white precipitate in limewater (CO2)
Negative result: “No gas evolved”
Test for ammonia gas: Place a damp red litmus paper near the gas
Expected positive observation: Red litmus paper turns blue
Negative result: “No colour change on litmus paper” or “Litmus paper remains red”
For graphing problems: Keep the mark scheme in mind
Some experiments will require you to tabulate your results and plot a graph based on those results. Not only will the graph itself be graded for a significant number of marks, it is also necessary to answer later sections, so spending some time to draw a clear and clean graph is worth the effort. However, many students do lose marks on the graphing section, mostly because they are unaware of what examiners are looking for when grading their graphs; hence, it is important to know how marks are awarded for graphs in order to secure those points.
Accurate Plots: This may sound very obvious, but you are awarded 1 mark if the all the points you plot on the graph paper match your tabulated data. This is a very easy mark to score as long as you are careful with plotting your data points; however, it is always important to verify what your x- and y-axes represent, and that you are plotting the correct set of data (e.g., temperature change vs actual temperature). Do remember to mark your points with a cross (×) instead of dots (●), as overly large or small dots may not clearly show the examiner the values you are plotting
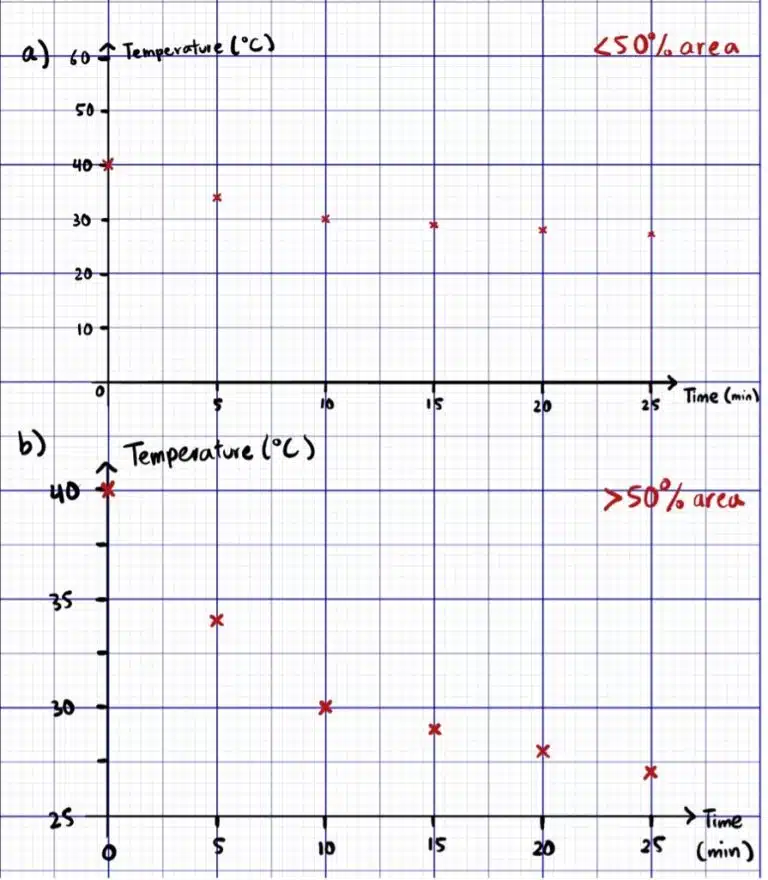
Graph Size and Scales: You are awarded 1 mark if your plotted points cover at least 50% of the area on the provided graph paper. Many schools teach students to cover at least 75% of the provided graph paper, and in general this is a good rule of thumb to work with when deciding on an appropriate scale for your x- and y-axis.
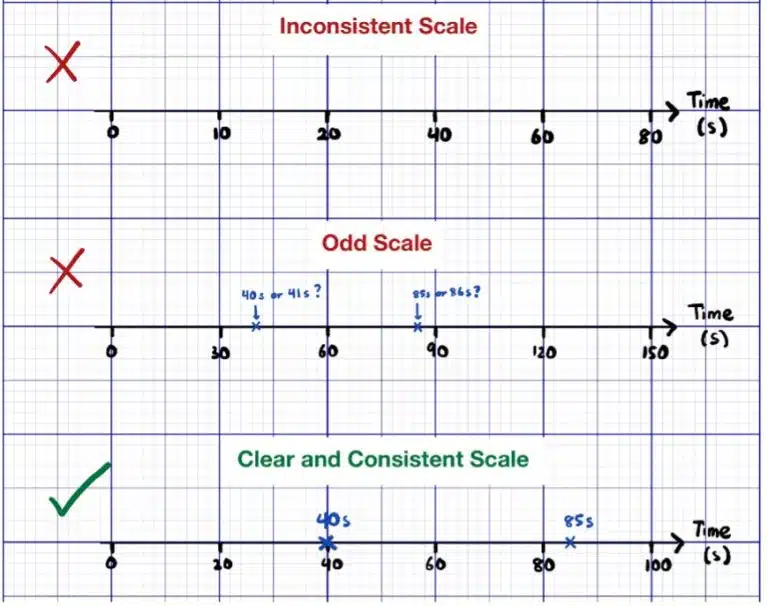
Whenever possible, you should avoid using “odd scales”, or scales that are considered difficult to read or interpret. This includes inconsistent scales, where one square represents different values in different regions on the same axes, and unusual scales based on numbers other than multiples of 2, 5 or 10. For example, a graph where 1 large square or 10 small squares represents 3 or 7 units is very difficult to read. Remember that the examiner does need to verify that your plotted points are correct, so if your scale makes it difficult for them to read your points, they can penalise you for up to 1 mark.
There are some cases where it may be difficult to fit in all points within 50% of the graph area because the data starts at a large number e.g. temperature data over time ranging from 25-40°C. If this occurs, you may instead choose to start your axes at a non-zero value in order to improve the readability of your graph, as long as your graph is not expected to pass through the origin (0,0).
Axis Labels: You can score up to 1 mark for just labelling your x-axis and y-axis correctly. This is a very easy mark to score as long as you know what you are plotting and what its unit is, but it is also an easy mark to lose if you forget to label the axes, or flip your x-axis and y-axis. In general, remember that your x-axis should represent an independent variable that you are actively changing during the experiment (e.g. time, volume of solution added) and your y-axis should represent the dependent variable you are measuring (e.g. temperature, mass remaining, volume of gas collected).
With ample preparation and by keeping these tips in mind, the Chemistry practical test will feel less like a panicked race against time and more like a routine procedure for you to master and prove your skills through. Regardless of what is tested during any particular year, what’s most important is to keep a calm mind and stay focused on what you know, as even when it comes to practical tests, preparation is half the battle.
Find out more by joining us at Science of Studying!
Prepared by: Nadine
You might want to download a pdf copy of this article for future reference!
Click the white download button below, enter your email, and the pdf file will be delivered to your inbox! (Remember to check spam!)
The Science of Studying provides live online tuition via Zoom classes for Combined/Pure Chemistry, Biology, and Physics. To date, we have taught 800+ students over 12 years.
In case you are wondering, yes – there is a science behind studying!
At Science of Studying, we use our SOS system™ to teach our classes so that even last-minute students can see remarkable improvements in their grades – without mind-numbing memorisation of textbooks and without the drudgery of doing numerous assessment books.
All these conducted in a fun, interactive, stress-free online environment.
If you need help with your Chemistry, Biology, and Physics subjects, do reach out to us and we will see what we can do to help.
Contact Us: Click Here
Admin number: +65 88082348

The SOS system™️ guides students through an effective process of:
Join our proven online tuition programs and see real improvements in understanding, confidence, and school results.
Book a free trial lesson and start the journey today or discover more below:
WhatsApp us